Reading AQI properly: what PM2.5 is really telling you
Airleaf research team · · 6 min read
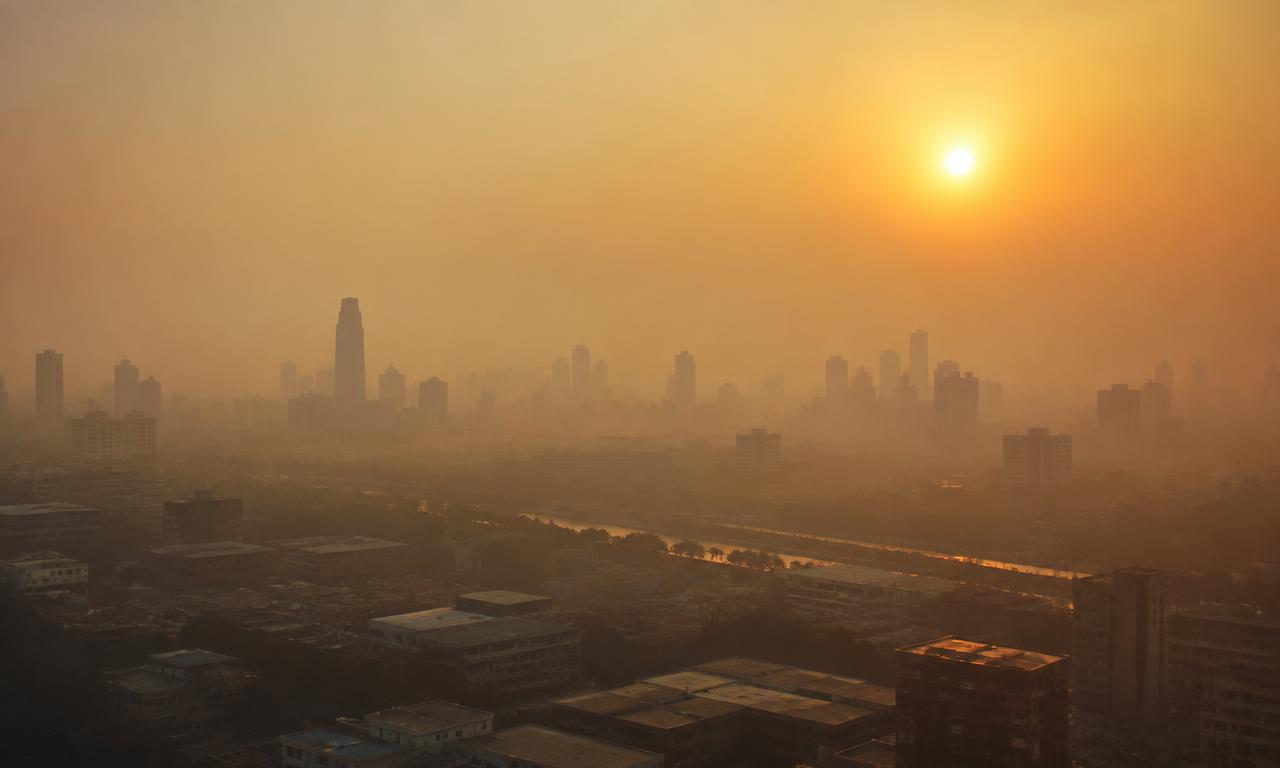
The Air Quality Index is a translation layer. It takes several pollutants measured in micrograms per cubic metre and reports the worst one on a single 0–500 scale, so you do not need a chemistry background to decide whether to go running.
One number, several pollutants
AQI is computed for each pollutant separately — fine particles (PM2.5), coarse particles (PM10), nitrogen dioxide, ozone, sulphur dioxide and carbon monoxide — and the highest of those sub-indices becomes the headline figure.
In most South Asian cities the headline is PM2.5 almost every day of the year. That is why a single reading can jump while the sky looks unchanged: the particles doing the damage are around 30 times thinner than a human hair.
Why PM2.5 matters more than the rest
Particles under 2.5 micrometres bypass the nose and throat entirely, settle deep in the lungs and pass into the bloodstream. The World Health Organization's guideline is an annual average of 5 µg/m³ — a level most large cities exceed many times over.
Long-term exposure is linked to heart disease, stroke, reduced lung development in children and lower birth weight. Short spikes mostly show up as asthma attacks and hospital admissions within a day or two.
What the bands mean in practice
US AQI bands are colour-coded for a reason — the advice changes sharply between them.
- 0–50 Good — no precautions needed
- 51–100 Moderate — unusually sensitive people may notice symptoms
- 101–150 Unhealthy for sensitive groups — children, older adults and asthmatics should ease off outdoor exertion
- 151–200 Unhealthy — everyone should cut back hard outdoor activity; run a filter indoors
- 201+ Very unhealthy to hazardous — stay indoors, seal gaps, use N95 masks outside
Where trees fit
Trees are not an air filter you can switch on. A single street tree removes a modest amount of particulate matter, but a continuous canopy along a corridor measurably lowers dust and roadside PM, and shade cuts the heat that drives ozone formation.
The honest framing: trees are a long-term, compounding intervention alongside cleaner fuel and traffic policy — not a substitute for them.
Put it into practice
See the canopy and air quality of your own street, then plant what it's missing.
Analyse my area →